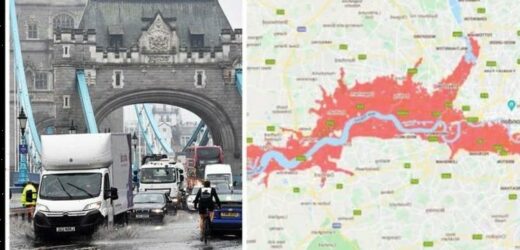
London flooding: Passengers rescued from car in Worcester Park
We use your sign-up to provide content in ways you’ve consented to and to improve our understanding of you. This may include adverts from us and 3rd parties based on our understanding. You can unsubscribe at any time. More info
The capital was drenched by a downpour of rain last night that caused severe disruption It brought havoc and major disruption to several Tube and overground train lines, filled the roads with water and left people knee-deep in the floodwaters as the downpour overwhelmed London’s drainage system. According to the Met Office, St James’s Park recorded 26mm (just over an inch) of rainfall in just one hour.
It also brought chaos to commuters this morning, with Transport for London reporting that four lines were suspended as major flooding at stations on the Metropolitan, District, Piccadilly and Circle lines caused signal failures.
The Mayor has previously warned Londoner that flooding could be “catastrophic” for the city, as the increase in frequency due to climate change threatens homes and transport lines.
But a flood map shows just how devastating it could be.
Published in August, it shows the whole bank of the River Thames could be at risk, apart from Westminster, Soho and the City of London as extreme weather becomes more common due to climate change.


The map also showed that the majority of east London, including Stratford, Canary Wharf were particularly at risk.
The map also warned that areas across the corners of the city were vulnerable, with south London areas like Clapham and Brixton at risk, while parts of the west like Fulham and Hammersmith were suggested to be in danger to too.
North London appeared to be the least at risk, with the predicted flood zones only stretching from Tottenham to Hackney.

But in data analysed by London’s City Hall and Bloomberg Associates, they warned that the borough of Islington in north London is also at high risk from flooding and overheating effects of climate change.
It allows users to pull up the tool’s layers of maps, click anywhere on the world’s ocean and coastlines, and choose any decade between the years 2020 and 2150.
DON’T MISS
German Greens to work with UK if they gain power [INSIGHT]
Scientists claim giant comet is hurtling towards the Milky Way [REVEAL]
UK to dodge EU power chaos as ‘remarkable’ link with Norway goes live [REPORT]


Users can also focus on the effects of different processes that create sea level rise like melting ice sheets.
NASA Administrator Bill Nelson said: “As communities across the country prepare for the impacts of sea level rise, access to good, clear data is key to helping save lives and livelihoods.”
Source: Read Full Article


