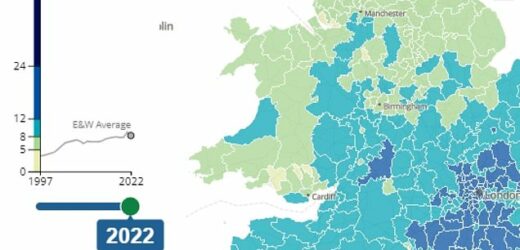
How affordable are homes in YOUR area? Interactive tool shows Chelsea remains least affordable area while Copeland is the most affordable – and data reveals workers in England should expect to spend EIGHT times their salary on a property
- Workers in England could expect to spend 8.3 times their earnings on a property
- Housing affordability has worsened in every local authority over the last 25 years
House-hunters in England could expect to spend around eight times their annual earnings to buy a property last year, data has revealed.
The average home sold for £275,000 in England in 2022, while average earnings for full-time workers were £33,200, according to the Office for National Statistics.
This means full-time workers in England were spending around 8.3 times their annual incomes on a property purchase.
The equivalent figure in Wales was 6.2 times annual earnings, where the average home sold for £190,000 and average full-time earnings were £30,600.
The ONS found that over the last 25 years, housing affordability had worsened in every local authority in England and Wales – especially in London or surrounding areas.
The least affordable area remained Kensington and Chelsea in west London, while the most stayed as Copeland in the North West.
This reflected low house prices and high workplace earnings, which the ONS said may be influenced by the characteristics of jobs in Copeland – where there has been a history of nuclear industry.
Use the interactive tool below to find out how affordable homes are in your local area:
The ONS study revealed that, in the 330 local authorities in England and Wales, housing affordability improved in 235 (71 per cent) since 2021, worsened in 89 (27 per cent), and stayed the same in the remaining 2 per cent.
Housing affordability was shown to have improved in England from last year, when full-time employees could expect to spend 9.1 times their annual earnings on a property.
But the long-term trend is worsening housing affordability.
The ONS pointed to how a sharp increase in house prices in 2021 corresponded with increases in the volume of sales and changes in taxes such as stamp duty.
‘The ratios in 2022 are therefore a return to the long-term trend, following a sharp increase in 2021,’ the ONS said.
In 1997, 89 per cent of local authorities had an affordability ratio of less than five times workers’ earnings, whereas only 7 per cent had this level of affordability in 2022.
When compared with 2019, a quarter (25 per cent) of local authorities saw an improvement in housing affordability in 2022, while three-quarters (75 per cent) saw it worsen.
Average house prices increased in 64 per cent of areas, compared with 2021, while average earnings increased in 71 per cent of places.
The ONS found that over the last 25 years, housing affordability had worsened in every local authority in England and Wales and especially in London or surrounding areas
The ONS said increasing house prices are the main cause of the change in housing affordability in England and Wales
Last year, only 23 areas (7 per cent) had homes selling for less than five times workers’ earnings
Last year, only 23 areas (7 per cent) had homes selling for less than five times workers’ earnings.
The most affordable local authorities in 2022 were in the North West, Wales and North East.
Meanwhile, 18 of the 20 least affordable local authorities were in, or around, London.
The least affordable area remained Kensington and Chelsea, where full-time workers could expect to spend 38.4 times their earnings on a property.
Copeland in the North West remained the most financially accessible, with a ratio of 2.9.
The ONS said there was not a direct relationship between house prices and earnings, as some areas have seen affordability ratios increase faster than others.
Their study added this had been influenced by a pronounced rise in house prices, with the highest increases in the past five years being in Wales and in Greater Manchester.
Source: Read Full Article


